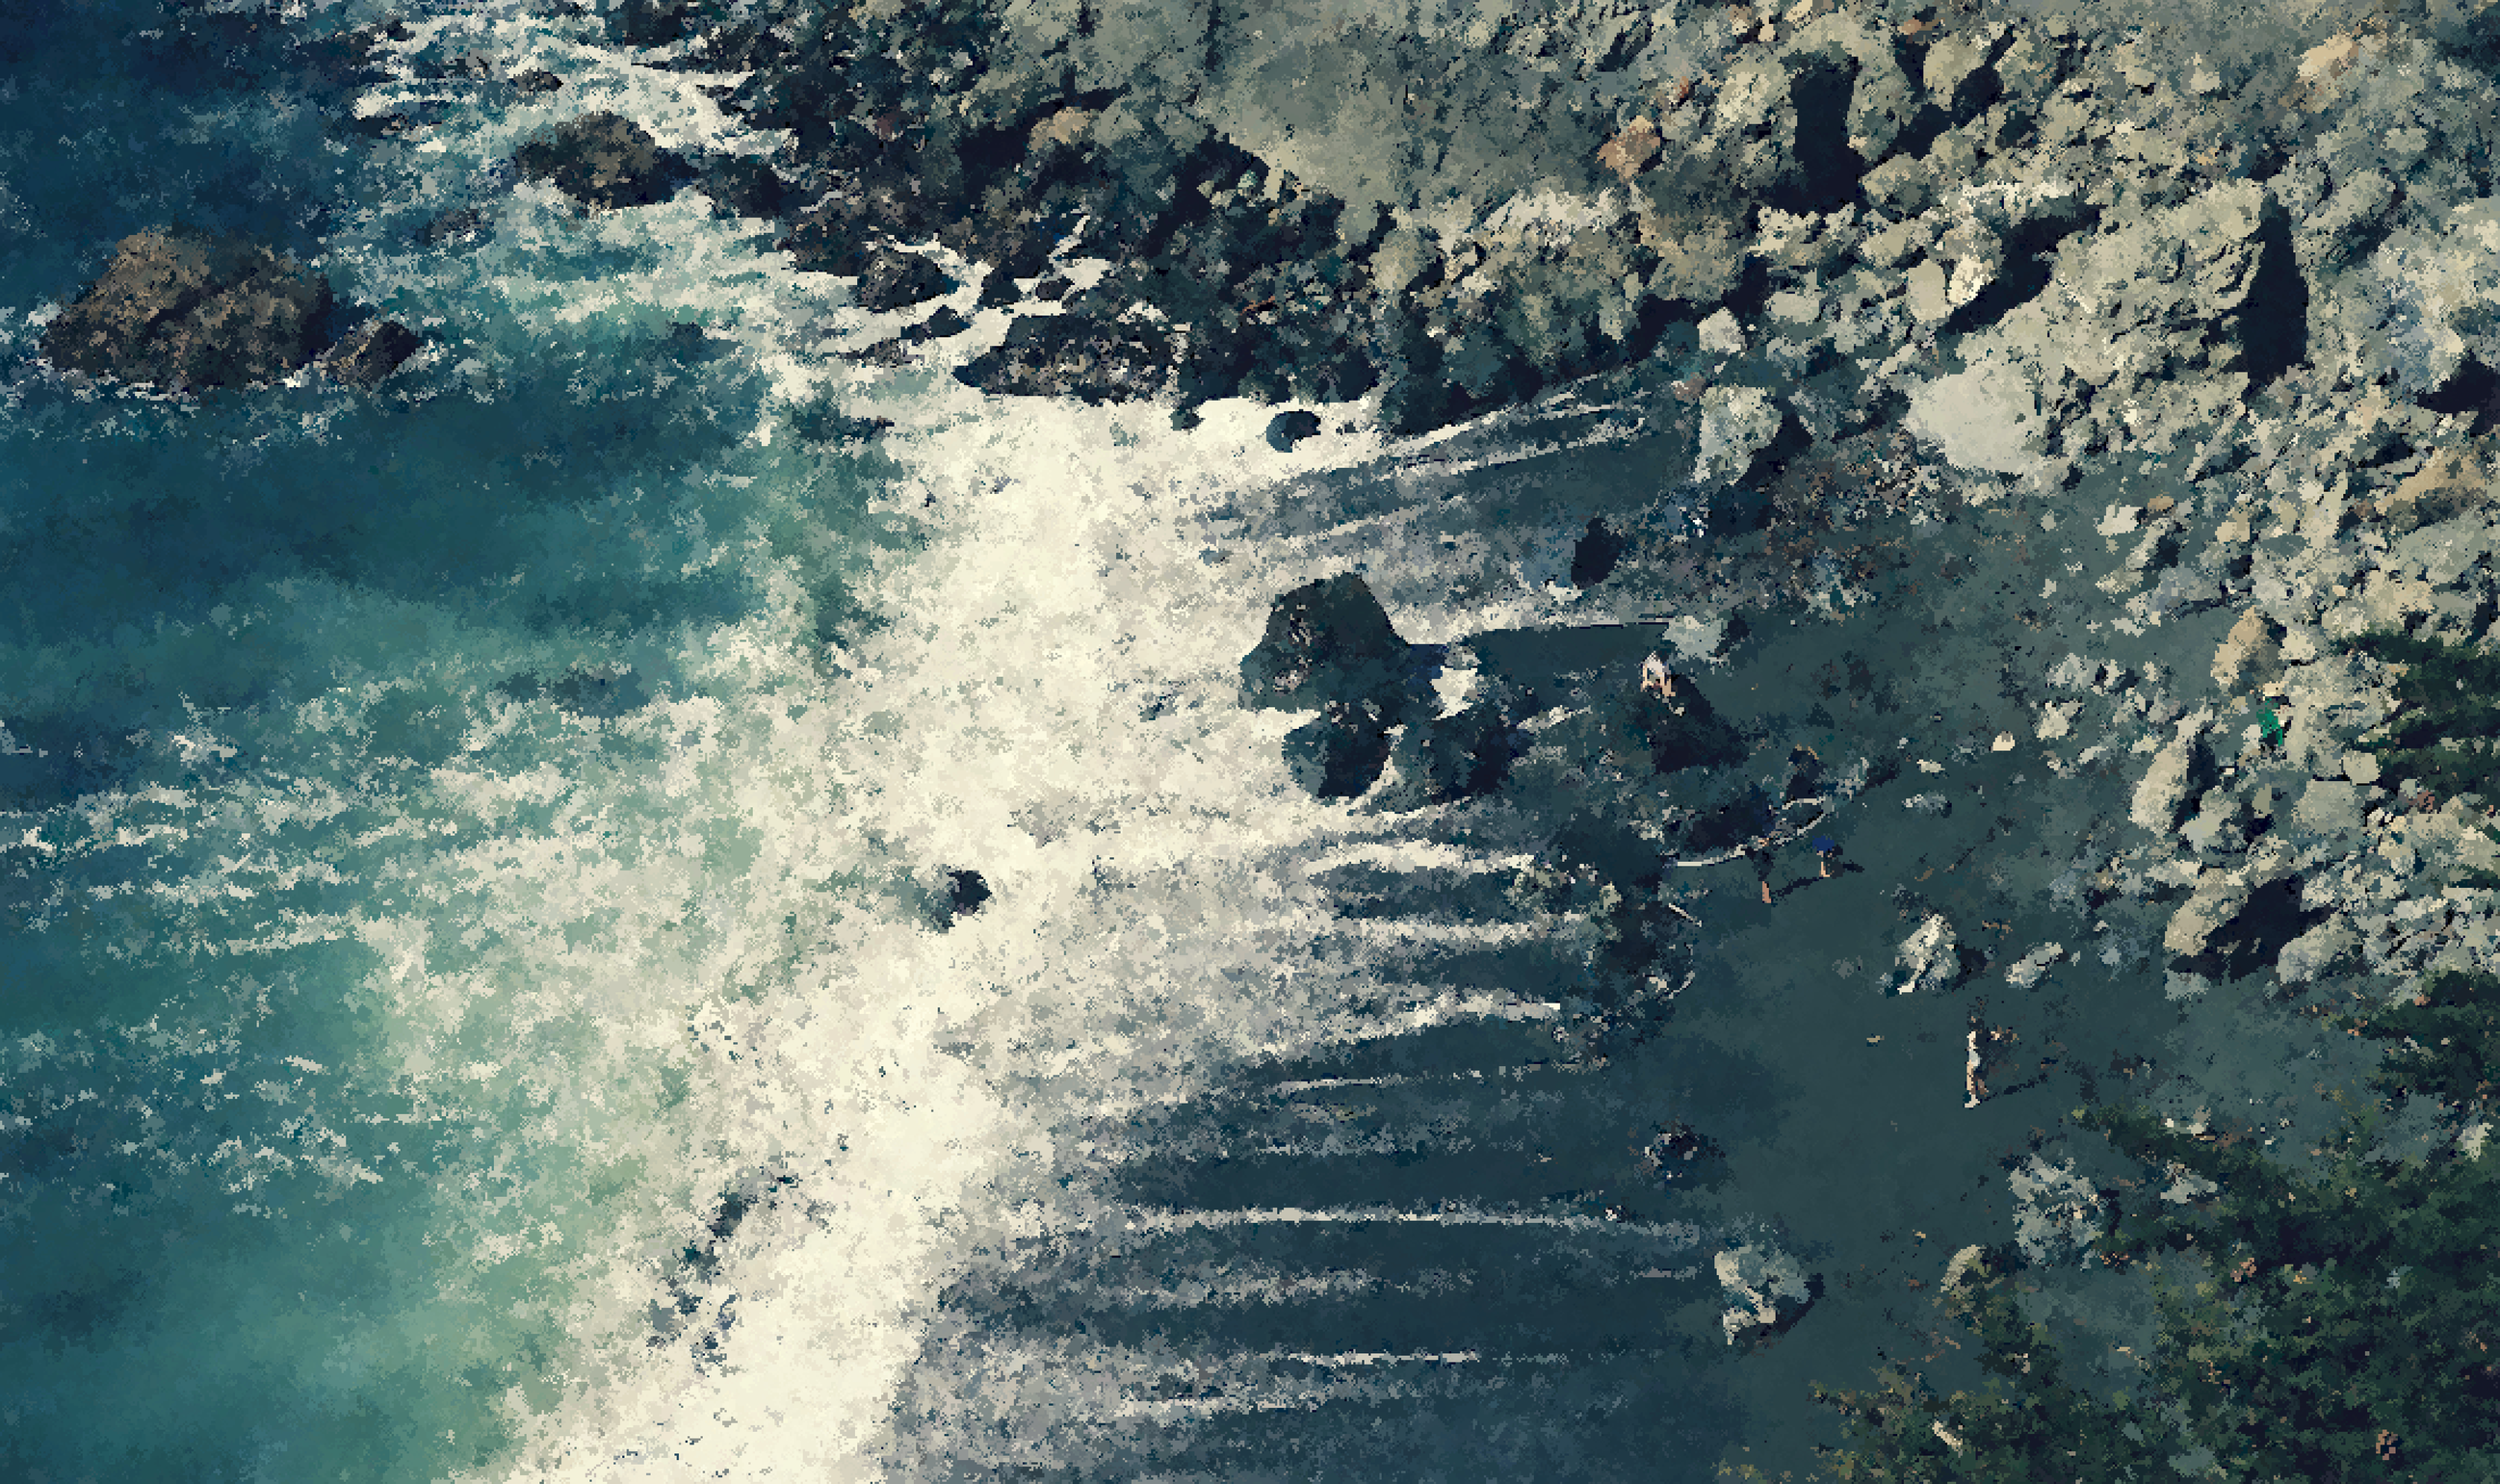
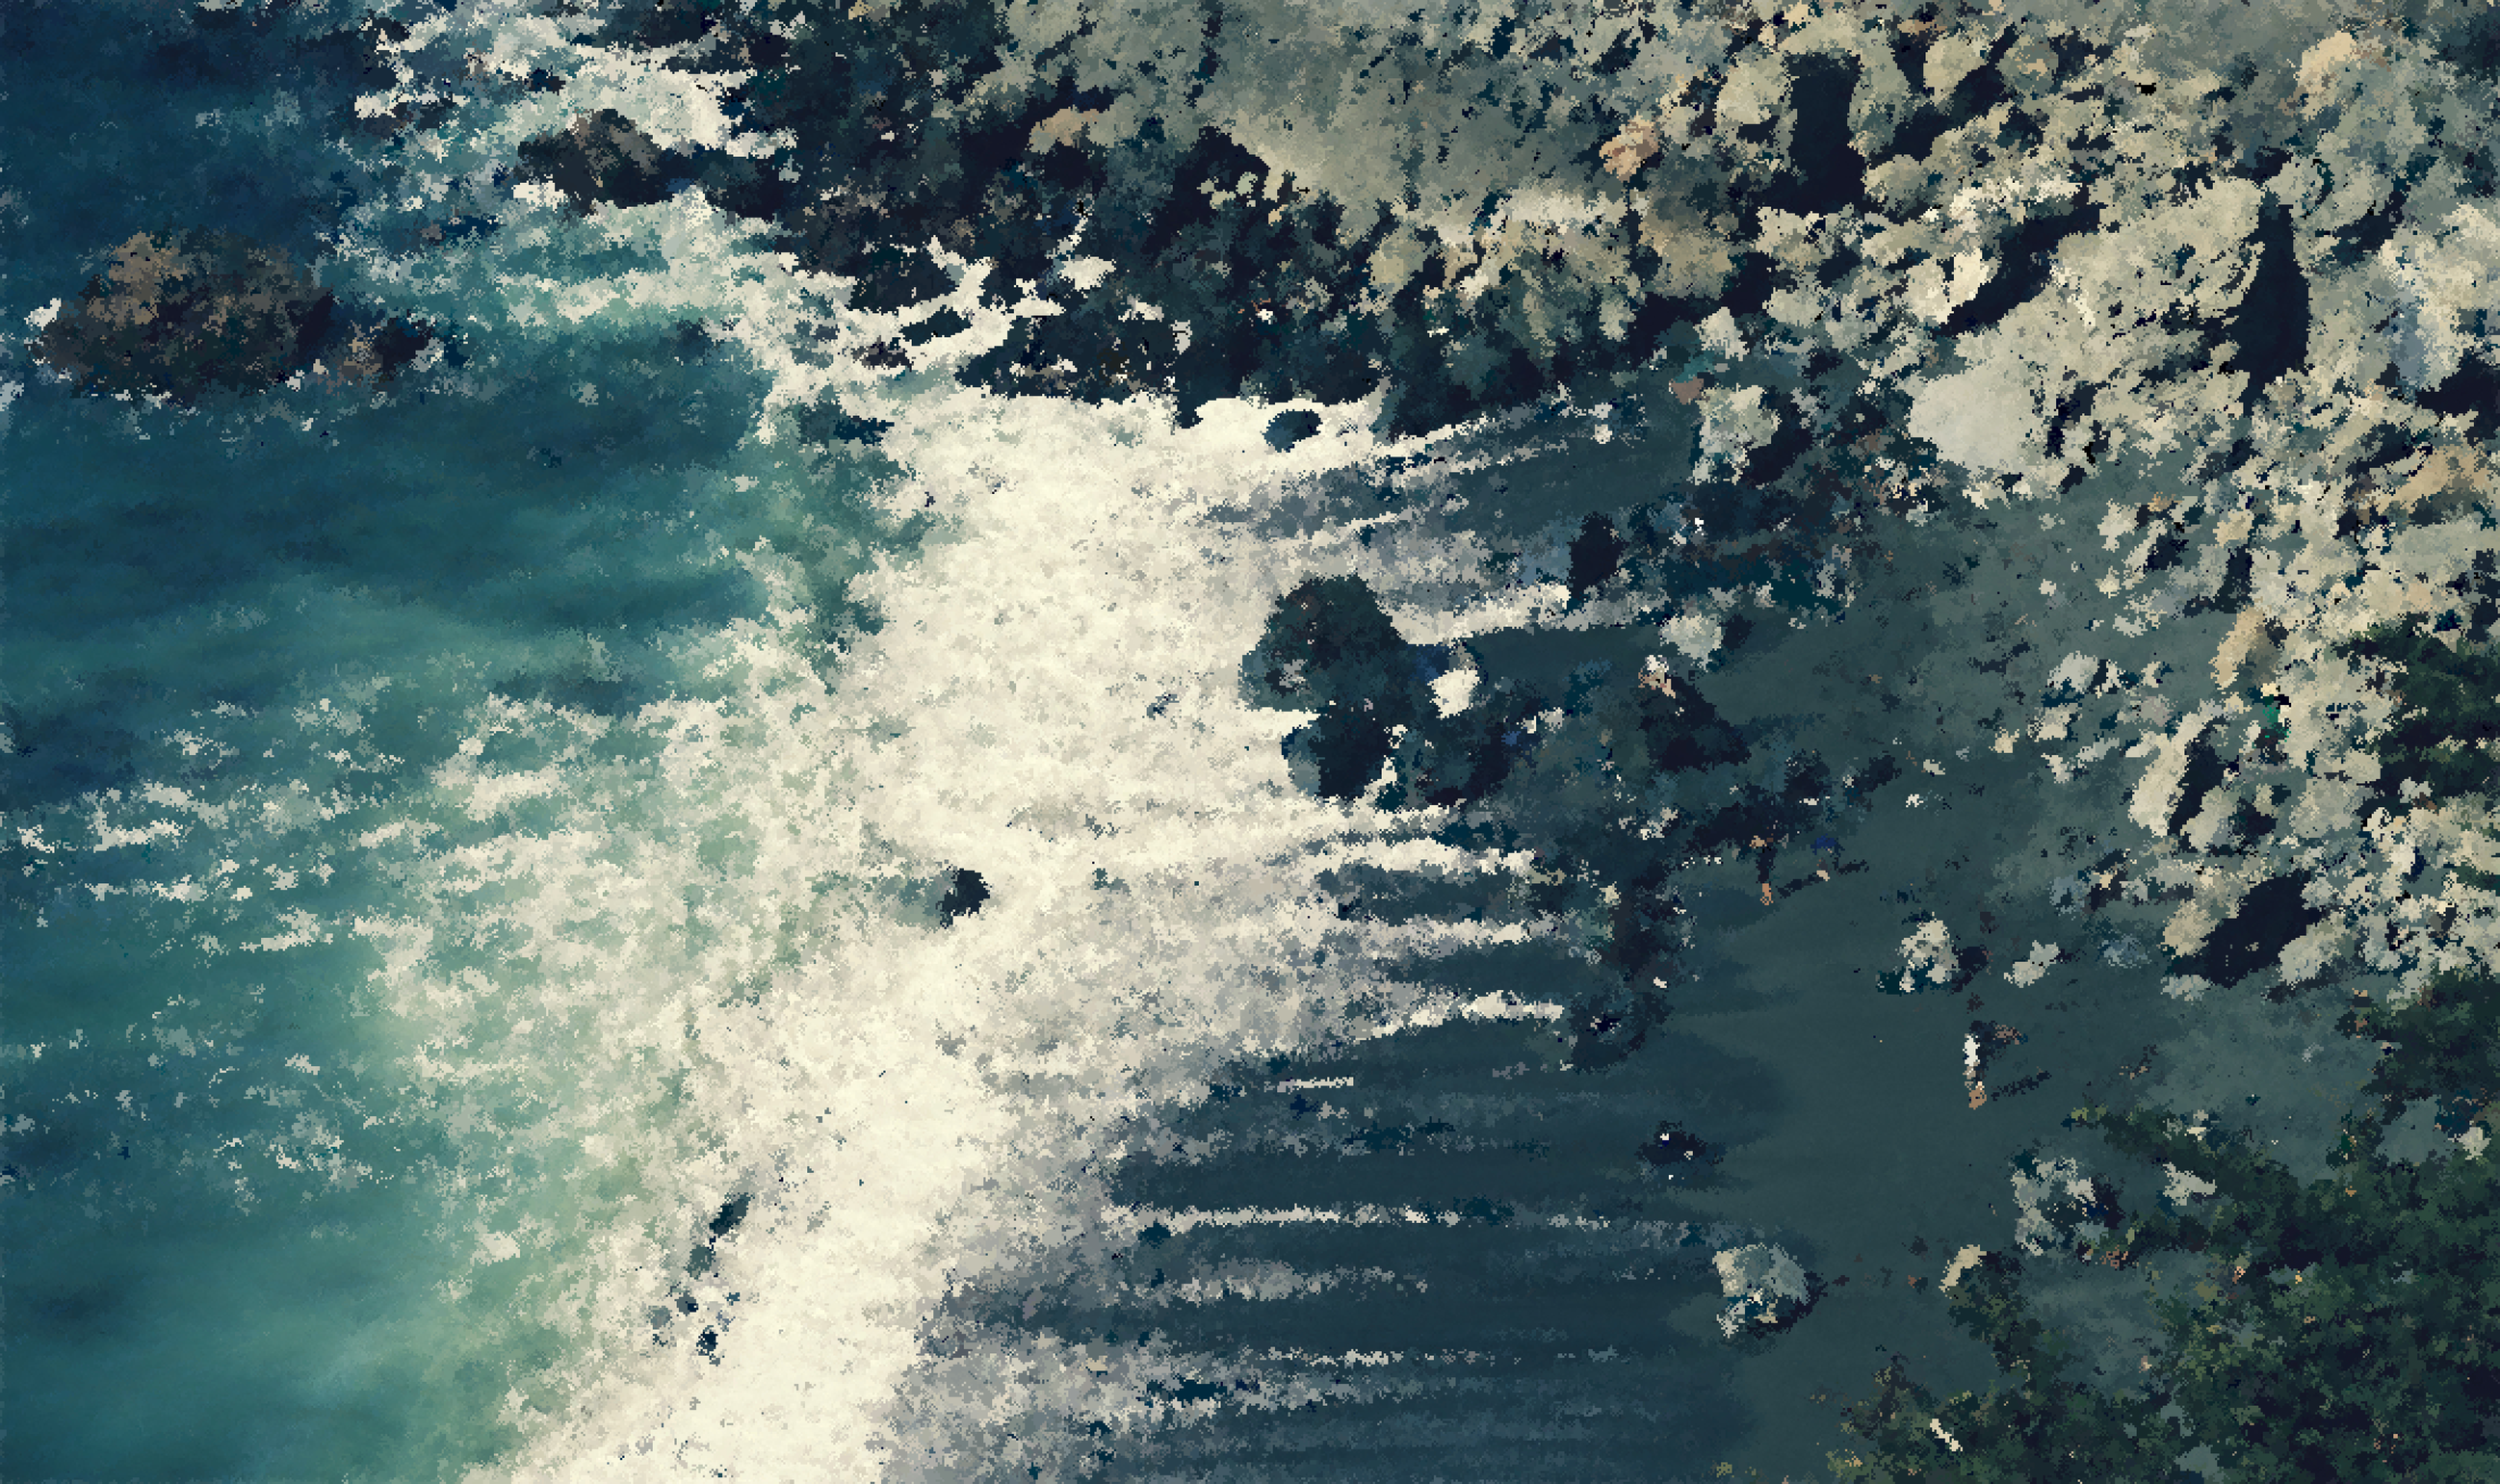
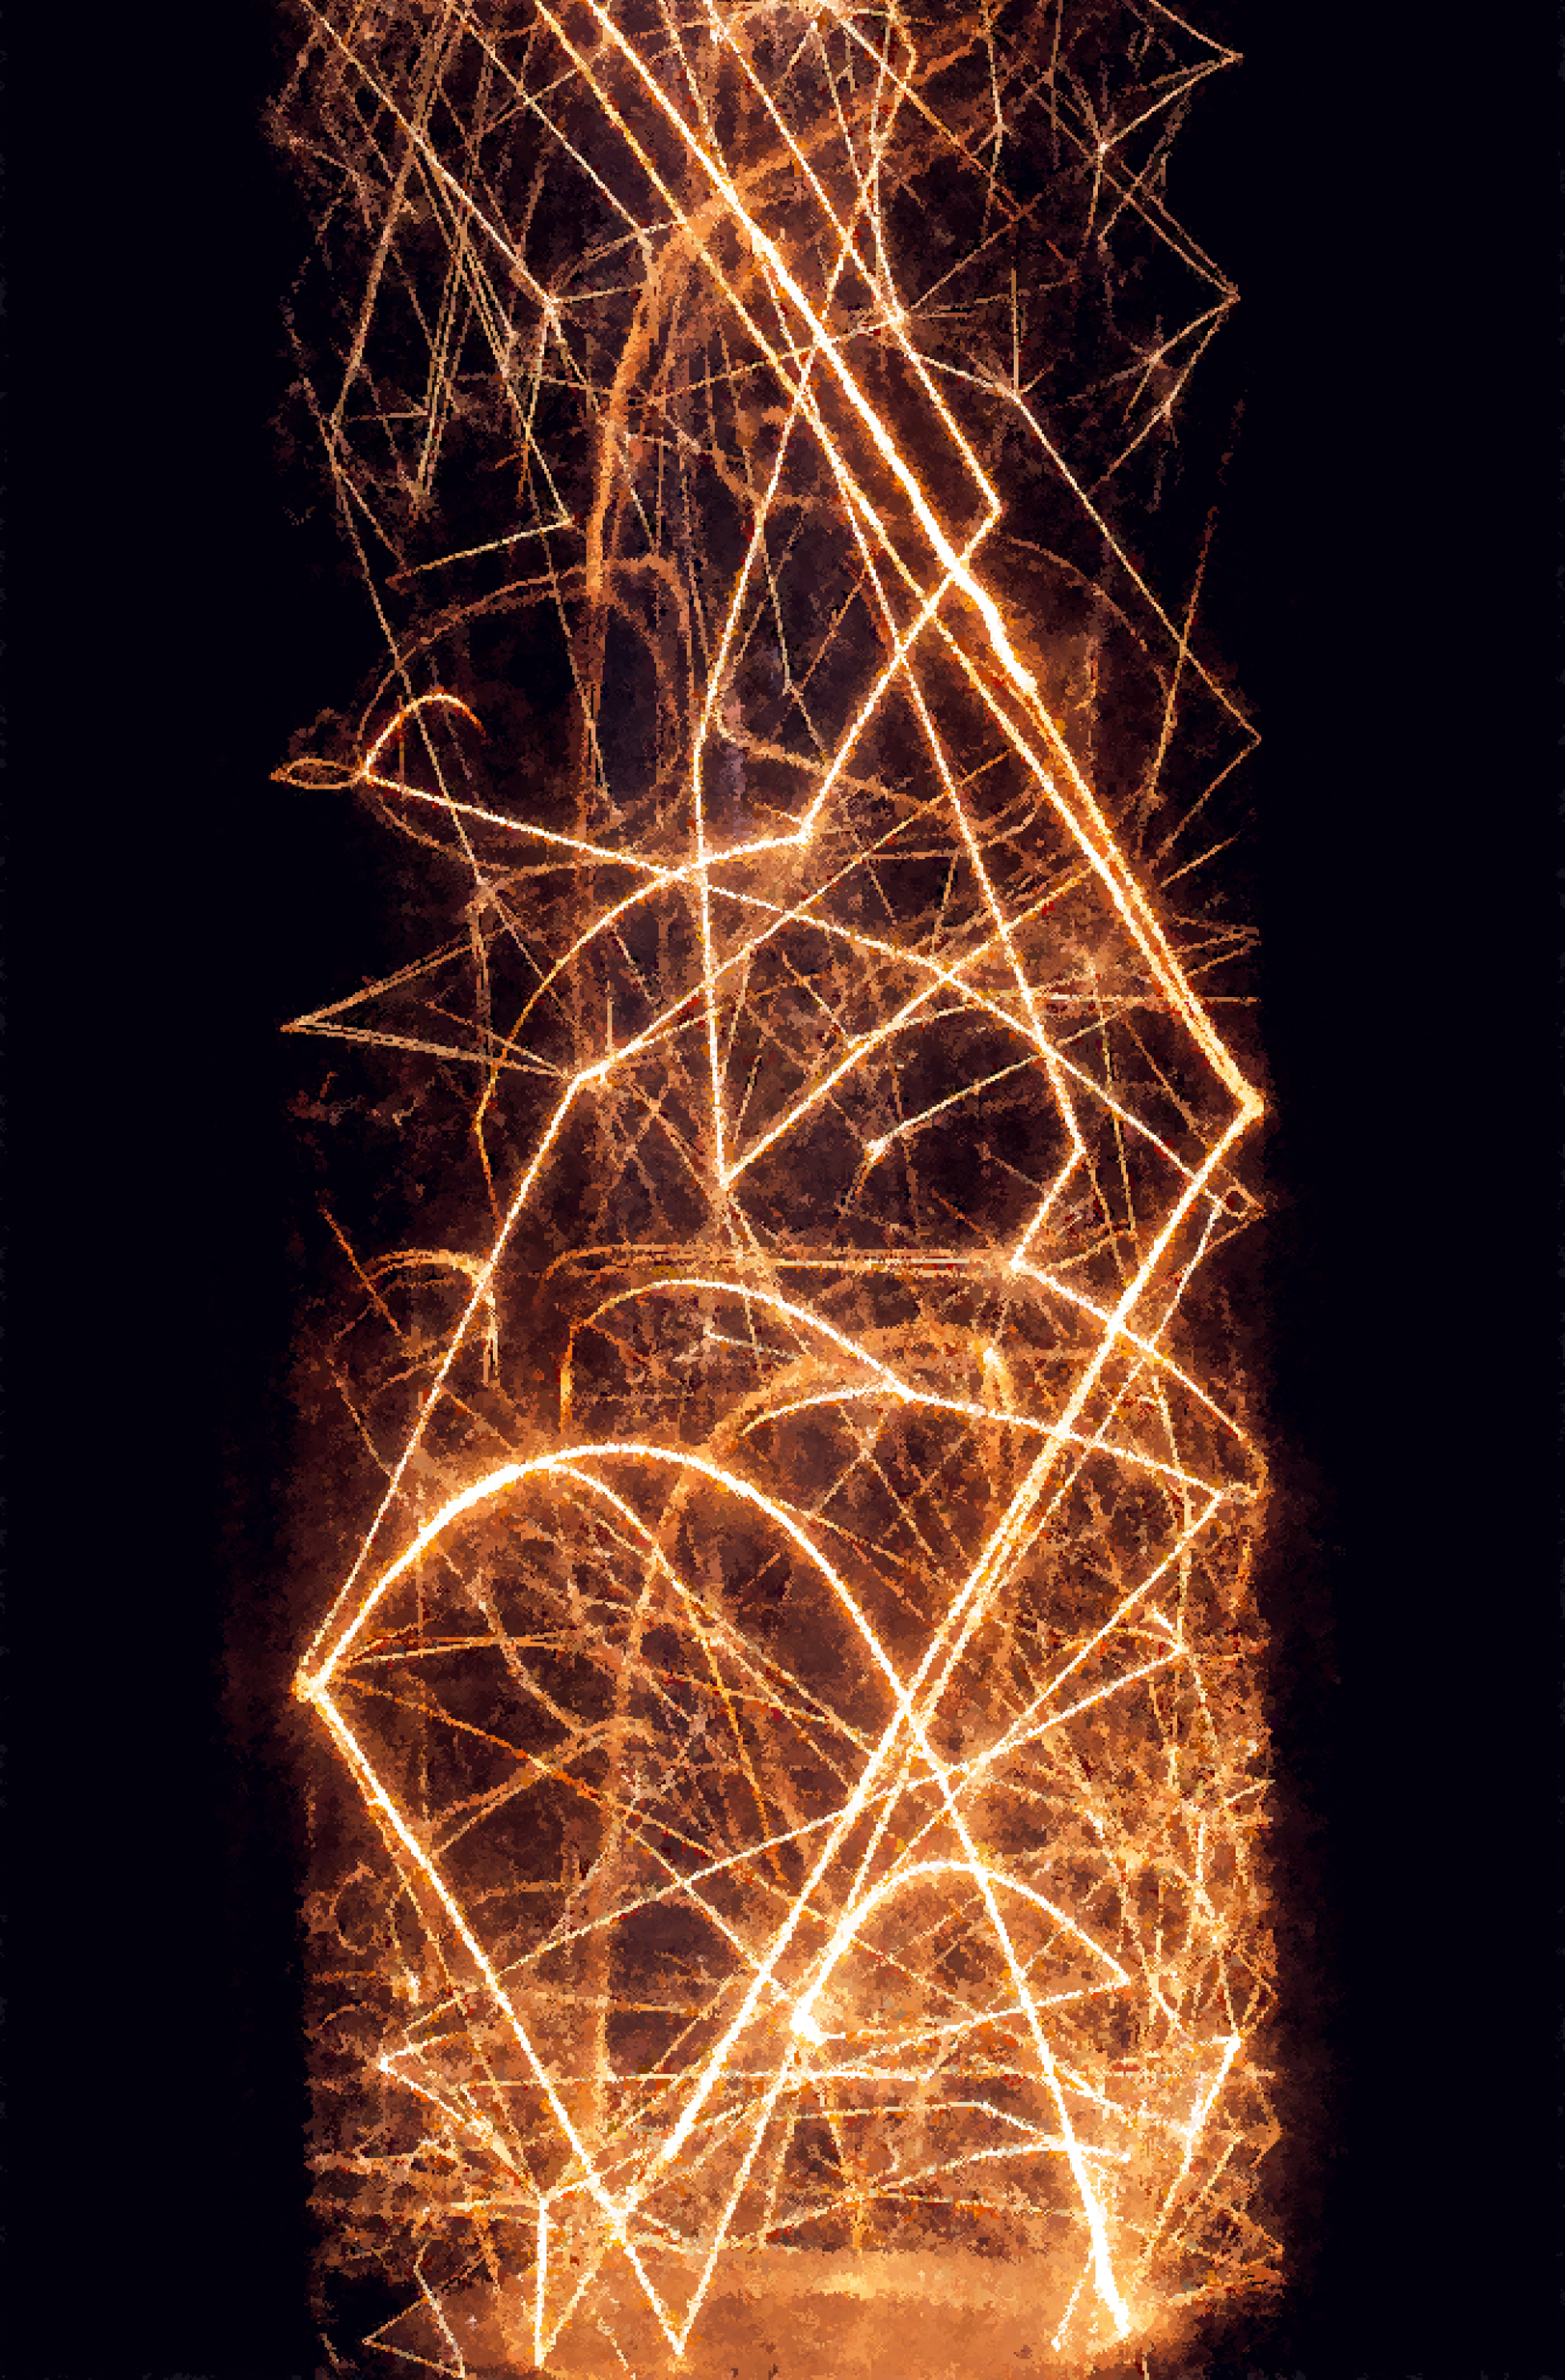
Dithering
This is an algorithm that I randomly came up with a while back. I thought the stuff it produced looked quite pleasing. Recently I cleaned it up a bit, did some performance optimization, and wrapped everything in an interactive GUI with Makie.
We start with an input image represented as a matrix of pixels, and iteratively let each pixel copy the color of a neighboring pixel. The rules for this copying process are as follows:
At each iteration, each pixel has a chance to copy a neighbor's color. How likely this happens depends on a copy rate parameter p, as well as the flux value of the pixel's position which we'll later discuss.
If a pixel decides to copy a neighbor's color, then it is more likely to copy a similarly-colored one. In implementation, we randomly sample the set of neighbors with weights that are correlated to color similarity, such that similar colors get selected and copied more often.
After experimentation with just the first two rules, I found that the images tend to get universally blurry. The resulting texture has some desirable qualities, but we also lose most details on the original image. In response, I added a third rule:
Pixels around perceptual edges of the image should change color less frequently, to preserve these edges to a degree. This is where the flux value comes in: each pixel position has a flux value that is essentially the average color contrast of the input image at that position, a representation of how "edgy" the image is here. Note that the flux values are computed based on the input image only and remain constant throughout the iterations.
There are also multiple nontrivial ways to define a pixel's neighbors. Here we use the Moore neighborhood, which consists of the 4 adjacent and 4 diagonal cells. I've experimented with larger neighborhoods which include more and further away pixels, but those are more computationally expensive to run and the results are visually similar.
All base images are photographed by me.
Long side note on function curves
In this project, as well as many others, I often find the need for a tunable adjustment curve. For example, for choosing the sample weight in rule 2 above, I'm using the ∆E94 metric for measuring color similarity (see ∆E), which gives me a number representing the perceptual color similarity between two colors. I could just be lazy and set the weight to this number. But what if I want to weight similar colors a lot more than different colors, like a 1% difference being weighted 99 while a 5% difference weighted 1? In short, I want to characterize a nonlinear relation between two variables, and I want to be able to fine tune that relation without crunching too many number?
Long story short, I tinkered around with sigmoid functions and their inverses and eventually found somethingI quite like. Given the standard logistic function and its inverse , this adjustment curve is, with parameters and ,
This curve has several nice (though not rigorously proven) properties:
It's a sigmoid-like curve that maps to bijectively in all but a few edge cases ( or );
It always passes through the point and varies with pretty intuitively;
The parameter controls the slope of the curve at the control point, and as changes the entire curve bends to readjust while remaining fixed at the control point;
It is either monotonically increasing () or decreasing (), only exception being a flat curve at .
You can see these for yourself in the demo below; the control point and slope value are draggable and their positions on the x-axis correspond to the valueo of and respectively.
It turns out that I'm not the first to discover this curve. AFAIK the only other mention of it is this Medium article, also introducing the curve's discovery. Notably, the article starts from desired properties and actually derives the curve's formula by solving differential equations. Given that it is such an informative article, I recommand checking it out for further information.


